For the majority of the twenty-first century, driven by data has been the main goal. Companies have used data to build better products and better features. To do that, you’re going to need some software to monitor the data and information being generated from your application. Application monitoring tools can help.
In this article, we examine the 10 Best Application Monitoring tools that your company can utilize. We will ensure when you can utilize them, provide our top recommendations for tool selection, and explain how using an APM is beneficial for your company.
What is Application Monitoring ?
Application Performance Monitoring (APM) identifies and oversees a software application’s performance and end-user experience. APM is meant to preserve a lowering of expectation standard of service by measuring the application’s current events.
Why You Need An Application Monitoring Tool ?
There are many reasons to employ application monitoring tools.
- Ensuring efficient performance and availability: Application Performance Monitoring tools have the goal of ensuring that applications are functioning effectively and available when all stakeholders need them. APM Tools provide an opportunity within real-time analytics to uncover deviations and concealment of bottlenecks before they affect users. This can result in a better user experience and even less downtime.
- Scalability and cost optimization: As cloud environments are dynamic, APM tools help manage this complexity as they have access to relevant data to scale resources when needed. They record resource usage, and can point users towards assets and services consuming unnecessary resources and whether they can be turned down or migrated while in a low usage period, optimizing costs and ensuring your application is still running without incurring unnecessary costs.
- Security and compliance : APM tools give visibility into where potentially vulnerable areas in applications are allowing organizations to take steps to secure their application. This is needed especially in a cloud setting where an organization’s infrastructure spans multiple environments and having a centralized monitoring tool can help maintain security and compliance.
- Operational efficiency: By eliminating the need for manual monitoring, APM technologies increase team productivity. APM tools can also present analytics and reports to team members to view trends and make data driven decisions to improve application performance and reliability.
Application Monitoring Tools for Varied Use Cases
There are a few user cases most widely accepted for application performance monitoring.
- Monitoring response time: Keeping tabs on how long it takes an application to react to user queries.
- Uptime monitoring: Making sure that the application is running and is reachable.
- Infrastructure monitoring: Tracking all of the servers and hardware.
- Container monitoring: Tracking how the containers that the application runs in are working.
- Error rate monitoring: Monitoring errors and how frequently and what types of errors an application has.
- Resource usage monitoring: Monitoring CPU, memory, etc., and other resources used.
- Transaction tracking: Tracking the performance of specific transactions or a group of transactions for bottlenecks.
- User experience monitoring: Tracking the user experience and their interactions with your application to help user satisfaction.
- Log monitoring: Collecting all logs, but more importantly, analyzing logs for patterns and anomalies. Monitoring database performance involves keeping track of and evaluating the effectiveness of database queries.
- Network performance monitoring: tracking latency, throughput, etc. related to a network.
- Support for DevOps: Using as a tool to support collaboration between DevOps teams and used for CI/CD, monitoring and managing an application.
List of Top 10 Application Monitoring Tools
1. New Relic

A full-stack observability platform, New Relic offers monitoring for any technology in your stack. It is one of the most powerful free application monitoring tools available. What makes this platform strong is not only the real-time analytics and insights being delivered with its easy to use UI, but also the ease of troubles as a team. It has integrations with all the most popular frameworks and platforms, while also getting deep into custom dashboards. AI and machine learning analytics within the tool help identify anomalies and issues before they affect end-users.
Key Features:
- Real-time analysis: Real-time reporting and analysis will be provide for data and log patterns, user impact analysis for faults, etc., all of which improve understanding, and make troubleshooting easier.
- Real user monitoring: The APM view allows you to monitor KPIs in real-time, too, so you can identify issues before they impact the end user. You can also recreate the user’s activity on different browsers and mobile devices.
- Distributed tracing: Allows you end-to-end visibility into a service request’s journey so you can quickly trace lost alerts and track down issues.
- Integrations: New Relic APM has 750+ integrations with third-party tools that add a lot of versatility.
Pros:
- Easy-to-use interface.
- Able to build your own dashboards.
- Able to track errors and generate alerts by priority.
Cons:
- Can be expensive for larger scale projects, which is common with APMs.
- Advanced features will often require a steep learning curve for beginners.
Pricing:
- Free tier available.
- begins at $0.30/GB.
Rating: 4.8/5
Best for: Full-stack observability and cloud-native applications.
Website: https://newrelic.com/
2. Datadog
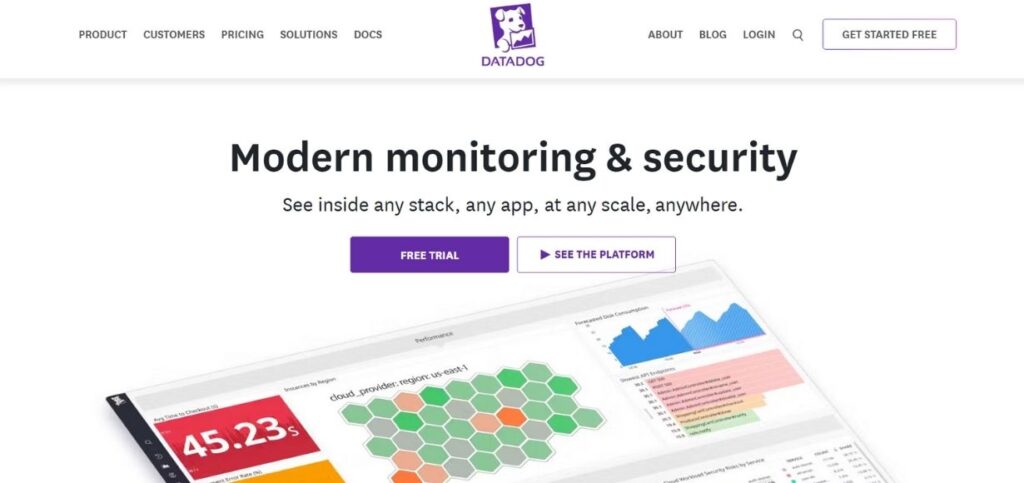
Datadog is a next generation modernize monitoring and data analytics solution created for dynamic cloud infrastructures. It was built on providing visibility into containers, microservices, and cloud services using a single platform. The product offers infrastructure monitoring combined with APM capabilities that are built to be used best by the DevOps team. Its features provide machine learning algorithms that aid in anomaly detection and issue prediction. The company’s integration ecosystem is broad enough to accommodate 400+ technologies.
Key Features:
- Code-level distributed tracing : powered by AI is available to see request flows between databases, mobile apps, backend services, and browsers.
- Interactive dashboards: You can obtain a centralized view of logs, metrics, database queries, network performance, and real user monitoring data. You can also collaborate using dashboards with your team and share them.
- Very accurate and actionable alerts : Built with machine learning that detects issues and offers actionable alerts to minimize downtime and false positives.
- Integrations: It has more than 700 integrations .
Pros:
- There is log management with audit trails and observability pipelines.
- For large, dynamic, cloud-native applications, it is scalable.
Cons:
- Steep learning curve and complicated setup.
Pricing:
- Has a free trial.
- It begins at $15 per host per month.
Rating: 4.7/5
Best For: Cloud computing and infrastructure monitoring
Website: https://www.datadoghq.com/
3. Dynatrace

This sets Dynatrace apart from its competitors through an AI first approach to monitoring and analytics through the Davis AI engine. The platform has automated the discovery and mapping of all components in your tech stack, meaning you now have a real-time topology map of dependencies.
Dynatrace minimizes MTTR by properly identifying the root cause and using deterministic AI capabilities to perform very accurate root cause analysis. Dynatrace’s OneAgent technology automatically instructs your entire stack with little required configuration, making it well suited to very large enterprises and their complex environment.
Dynatrace will position you in the middle of IT operation and business output by leveraging business analytics in tandem with your technical metrics.
Key features:
- Full stack observability enabled by machine learning: Full Stack observability provides AI-based, end-to-end visibility into technology stacks including applications and infrastructure, security and cloud environments.
- AI-enabled APM: Uses AI to autonomously generate root cause identification and diagnosis by analyzing topology, transaction and code level data. It includes predictive capabilities to foresee and avoid pending problems prior to user impact.
- Multi-environment monitoring: Monitors your private , public , cloud environments.
Pros:
- Causal data processing at scale, using data lakehouse architecture.
- Automated insights, and automation, via AI-enabled analytics.
Cons:
- It’s a complex process.
Pricing:
- Free trial for 15 days.
- It starts at $0.08/hour.
Rating: 4.9/5
Best for: AI-enabled Full Stack Monitoring
Website: https://www.dynatrace.com/solutions/application-monitoring/
4. AppDynamics

AppDynamics is a Cisco company post-acquisition, and the product concentrates on business impact analysis regarding enterprise-grade application performance monitoring. AppDynamics provides deep visibility with complex distributed systems and microservices architectures while possessing strong code level diagnostic capabilities.
AppDynamics is good for large enterprise organizations because it can provide transaction-tracking from end to end across disparaging technology stacks. With its machine-learning capabilities, it will help to anticipate and pre-empt performance problems. Automated baseline generation helps allow performance to be kept at peak level.
Key Features:
- Full-stack performance observability: It monitors the application’s whole lifecycle and offers performance information from the code to the production environment.
- Automated root cause analysis: It uses AI and machine learning to determine the highest probability root cause and can automatically analyze metrics regarding your application’s code, storage, infrastructure, or network.
- Smart alerts: You can receive highly relevant and accurate alerts with smart mechanisms to be triggered in order to reduce false positives and alert storms.
- Integrations: It provides integrations with tools like AWS and Docker and supports a large number of popular programming languages and frameworks.
Pros:
- AI insights in regards to Business Transactions.
- Investigate decision making on the Application level with code.
Cons:
- Advanced features can be complicated to learn.
- Cost may be prohibitive to smaller businesses.
Pricing:
Starting price is $33/month.
Rating: 4.7/5
Best for: Enterprise application monitoring.
Website: https://www.splunk.com/en_us/appdynamics-joins-splunk.html
Read More: Best Call Tracking Software
5. Instana

Instana is a fully automated application monitoring tool for modern cloud-native applications and microservices architectures. Its platform offers zero-configuration auto discovery and automatically maps everything in your environment as well as processing their service dependency maps in real time every second; therefore it is perfectly suited to dynamic environments.
Instana agrees with the Enterprise Observability Platform that provides complete visibility with complex environments, especially with containerized environments and in particular Kubernetes monitoring. Automated service new detection and service tracking has also been useful with fast-changing environments.
Key Features :
- Automated monitoring and discovery: One of its best features is automatic discovery of applications with automatic monitoring. It detects changes and transactions log these transactions then automatically starts monitoring others without manual configuration.
- Distributed tracing: It does distributed tracing of transactions across the different components of an application and provides real-time alerts with insights into the performance and interaction of individual components of the application.
- Automated root cause analysis: It uses data analytics to automatically identify changes, problems, and incidents. It also has reporting capabilities to monitor the operation of applications.
Pros:
- Data analytics is used for automatic incident management and issue resolution.
- Predictive alerting and recommendations
Cons:
- Confusing configuration that involves all the collaboration to make it work
- Pricing can be pricey for monitoring at a large scale
Pricing:
- Free trial available.
- Pricing starts from $75
Rating: 4.6/5
Best for: Microservices and Kubernetes.
Website: https://www.ibm.com/products/instana/application-performance-monitoring
6. Splunk

Splunk has a better grasp on managing data at scale, through monitoring and analytics. The platform indeed has data correlation capability from so many different resources and provides an understanding of both application and infrastructure performance. Its comprehensive search and analytics will assist teams with deep diving into issues across their technology stack.
Splunk is able to use the power of machine learning to identify patterns and outliers, all in real time; and its visualization will help one comprehend the even complicated relationships within data. The application platform provides enormous customization flexibility through apps and add-ons to modify for specific use cases.
Key Features:
- Distributed tracing: We trace errors from any changes to provide immediate visualization with distributed tracing (DTrace) to scope a problem and give insight into important components that are involved.
- AI-powered insights: We use ML to find anomalies and offer future trend forecasts, as well as automate root cause analysis and smarter alerting.
- Code profiling : Provides continuous code profiling to evaluate code-level performance and address performance issues and bottlenecks.
- Service maps : Gain out-of-the-box visibility to all service interactions, microservices, dependencies, and performance.
Pros:
- End-to-end tracing across distributed services.
- Strong data analytics and incident management.
Cons:
- May be complicated for new users.
Pricing:
14-day free trial for new users.
Rating: 4.8/5
Best for: Big Data analytics and monitoring.
Website: https://www.splunk.com/
7. Solar Winds

SolarWinds offers tools and technology that assist IT in managing their infrastructure. Their AppOptics platform, APM tool, has the capability to monitor across the stack and provides insight into diverse application performance dynamics and paths throughout historical versions of releases. The AppOptics solution supports cloud and hybrid environments and provides monitoring and visibility into their infrastructure and applications along with its supporting metrics and analytics.
Key Features:
- End-to-end monitoring: This provides monitoring from code level; distributed tracing; live code profiling; and exception monitoring.
- Reporting and visualizations: The fully customizable dashboard reports performance metrics for the entire application stack to give you end-to-end visibility so you can easily get to the root cause of performance issues.
- Dependency Visualizations: The_dependency visual map, or visual dependency mapping, visualizes performers dependencies across services so you can proactively monitor distributed applications and identify which microservice or database may be the root cause of your performance issue.
- Integrations: It provides centralized integrations for third-party apps and frameworks.
Pros:
- Multi-cloud-native/hybrid/on-premise environments.
- Dependency mapping, reporting and management.
Cons:
- Pricing may be cost prohibitive for larger scale projects.
- Instrumentations may be a longer install.
Pricing:
- Free for trial periods.
- Starts at $24.99 for full stack APM.
Rating: 4.7/5.
Best for: Actively monitoring and viewing data
Website: https://www.solarwinds.com/
8. Sumo Logic

Sumo Logic is the modern SaaS Log Analytics Platform that connects organizations with machine log and event data, organizes the noise into actions, and automates identifying and trouble-shooting security, operational and business events.
To bring groups and organizations into collaboration, to solve the hardest questions facing organizations and teams that are digital companies and organizations, powered by actionable insights through data. Bringing teams together to solve observability and security challenges of digital companies.
Key Features:
- Unified Application observability. It contains all your application data .
- Automatic discovery. Once you deploy new apps, services, and infrastructure, it will discover them and creates automatically configured alerts.
- Visualizing Dependencies. You can visualize service dependencies and has dashboards you can customize to visualize dependencies, so you can find problems more easily.
Pros:
- Good all-in-one log management and advanced analytics.
- In-the-moment performance and security visibility.
Cons:
- A significant learning curve for new users.
Pricing:
- Free trial available.
- $3.14 per TB scanned.
Rating: 4.5/5
Best for: Log management, security analytics and cloud-native application monitoring.
Website: https://www.sumologic.com/
9. Grafana

This is one of the most widely used open-source platform for visualization and monitoring. Grafana is of such interest mainly because of its highly customizable and powerful dashboarding capabilities. The main strength of Grafana, is its ability to combine data from many different sources into seamless dashboards, and this is quite well suited for creating comprehensive monitoring solutions. Grafana’s plugin ecosystem is so extensive that it supports almost every possible type of data source and visualization as well.
Very good alerting rules and notifications Constantly innovating and improving from community development, active user participation, and frequent updates.
Key Features:
- Custom Dashboards : Highly customizable interactive dashboards for visualizing data
- Broad Support for Data Source Connections : Compatible with many sources
- Alerting System : Allows for easy alert setup, with thresholds and notifications through a variety of channels like Slack and email.
- Templating : Reusable dashboard framework for dynamic, scalable reporting and monitoring.
- Plugins : A rich plugin funnel with support for new chart and panel displays and data connections.
- User Access Control : Role-based access to allow management of permissions to users connected to a team.
Pros
- Open-source and free.
- Visually rich interface that is easy to use.
- Wide variety of options for streaming live data.
- Good community support and updates.
- Good integration with DevOps, monitoring tools.
Cons
- Learning curve for beginners is steep.
- Set-in-place time for setup and configuration.
- Most of the analytics and graphing ability is based on what your data source allows and
- Complexity of dashboard can cause performance issues.
Pricing
$19 per month.
Rating: 4.7/5.
Best for: Best for metrics visualization and analytics.
Website: https://grafana.com/
10. Scout APM

Scout APM has claimed to have full performance monitoring for Ruby and Python applications, and has added to the list of supported frameworks. This service provides a lot of details about application performance with little overhead. That’s why it could be the best one to use in production environments.
The transaction traces include a lot of detail about slow requests so that developers can easily locate performance bottlenecks and repair them. Scout makes debugging easier with excellent application performance monitoring tools, GitHub integration, and error monitoring. N+1 query and memory bloat detections will serve useful in Ruby on Rails apps.
Key features:
- Detailed performance auditing : identifies slow database queries, memory issues and code performance flaws.
- Real-time notifications : notify you about your app’s response times, errors, and throughput.
- Integrations : compatible with popular frameworks
- Memory usage : monitor memory leaks and memory usage patterns and behavior over time.
- Intuitive UI : clean, intuitive user interface that is developer friendly and provides insights quickly.
- Deployment tracking : analyze your deployments and what affects your app’s performance.
Pros:
- Easy to get started, and lightweight.
- Very focused on developing with actionable insights.
- Great for pinpointing performance bottlenecks in code.
- Good GitHub integration which means debugging is quicker.
- Great price for small to mid-size teams.
Cons:
- Some languages are only supported as limited integrations.
- Not suitable for enterprise class environments.
- Fewer options in terms of analytics and visualization
- Alerting and customization options are basic.
Pricing:
Starting at $99 per month
Rating: 4.4/5
Best for: Applications of Ruby and Python
Website: https://www.scoutapm.com/
Advantages of Application Monitoring Tools
1. Enhanced Application Performance
The APM tools track the application based on response times, speed of transactions, and server health in real time. This assists in comprehending the section where the optimization has to be achieved to allow an application to expand according to specific needs since users anticipate this.
2. Improved user experience
The second attribute closely associated with the performance of the application is end user satisfaction. APM tools are able to discover user interactions, identify pain points, and thus improve experience as a whole through the help of RUM and synthetic monitoring.
3. Real-Time Problem Detection and Resolution
Real-time detection of problems and fixing them is something that APM accomplishes. Advanced solutions with AI and machine learning installed in them easily detect anomalies and identify the root cause, presenting automatic resolutions.
4. Effective Utilization of Resources
The APM tools provide a view of the usage of resources by the application. Following measurement of server utilization, memory allocations, and CPU consumption, organizations can optimize resource allocation as wasteful spending is prevented.
5. Team Collaboration with Great Height
Current APM tools are incorporated into the workflow of managed DevOps to enable a lot more collaboration among the development, operations, and QA teams. They enable teams to work together to solve issues, enhance the entire system by offering a single view of the application’s performance.
Conclusion
While it is important to ensure businesses deliver dependable and high-performing applications, it’s important to realize that application performance monitoring tools deliver much more than that, enabling organizations to spend less time troubleshooting problems, and optimizing the user experience using real-time insights.
Other positive implications from appropriate application monitoring tools can equate to having operational efficiencies, and finally better business outcomes that can include increased satisfaction and loyalty from customers. APM tools are part and parcel of modern IT architecture, whether covering a small application, or larger more complex enterprise system.
FAQs
1.How do I select a monitoring tool?
For selecting a monitoring tool, you want to consider scalability, integration to your infrastructure, observability aspect, and the metrics relevant to your operations.
2. What is the difference between application performance monitoring and infrastructure monitoring?
Application performance monitoring evaluates application performance and behavior. Infrastructure monitoring on the other hand checks on the health and performance of the architecture behind that application.
3. How critical is tracking user experience in an APM tool?
Tracking user experience is critical in APM tool because you get feedback on how that end user is performing. In addition, it is finding performance issues that directly impacts user experience.
4. Why do APM tools matter?
APM tools are very critical to better identifying performance issues and improving a user experience through reduced downtime.
5. How do APM tools assist an incident investigation?
APM tools utilize features such as root cause analysis and AI-determined key insights into analyzing the source of performance issues.